I’m not the first person to do this (although I didn’t bother to read anyone else's posts about it), but I figured I’d jot down some basics while I was here.
Are you:
a thinkorswim user
curious about various trading strategies
too lazy to learn thinkScript
Your barriers to entry are gone. ChatGPT and Grok do a decent job of writing thinkScript. Example walkthrough from prompt to using it in thinkorswim.
ChatGPT prompt
Me:
I want to try to find a short-term 0DTE trading strategy that I could do manually at the minute(s) level. Where you come in: I'm thinking something along the lines of taking the stocks that dominate the S&P 500, seeing how SPX moves, and then how SPY moves to see if there's anything that might indicate whether to buy SPY 0DTE calls or puts (buy only as I want limited risk). My plan is to use thinkorswim to chart watch, and trade on Robinhood (I understand the risks, but I want to shave off the options fee). Write a thinkScript study we can start with. Make it tunable, and put the tuning parameters at the top of the script.
Chatty:
Here’s a thinkScript study you can start with. It tracks short-term divergences and relative strength between SPX and SPY, with configurable parameters to tune signal sensitivity. The goal is to spot moments when SPX starts moving strongly in one direction, but SPY lags — possibly creating a buy opportunity for 0DTE SPY calls or puts.
# SPX-SPY Divergence Signal Study for 0DTE Manual Trading
# Designed for use on a 1m or 5m chart of SPY
# Author: ChatGPT for [Your Name]

# === CONFIGURABLE PARAMETERS ===
input lookback = 5;                 # Lookback period for price change comparisons (in bars)
input divergenceThreshold = 0.2;    # Minimum % divergence to trigger signal
input spxMomentumLength = 3;        # Length for SPX momentum calculation
input useSMAFilter = yes;           # Apply moving average trend filter to SPY?
input spySmaLength = 20;            # Length of SMA for SPY trend filtering

# === FETCH SPX DATA (via symbol link) ===
def spxPrice = close("SPX");
def spxChange = spxPrice - spxPrice[lookback];
def spxMomentum = spxPrice - spxPrice[spxMomentumLength];

# === CALCULATE SPY CHANGE OVER SAME PERIOD ===
def spyChange = close - close[lookback];

# === CALCULATE RELATIVE DIVERGENCE ===
def divergence = (spxChange - spyChange) / close * 100;

# === TREND FILTER FOR SPY ===
def spyTrendUp = if useSMAFilter then close > Average(close, spySmaLength) else yes;
def spyTrendDown = if useSMAFilter then close < Average(close, spySmaLength) else yes;

# === SIGNAL CONDITIONS ===
def callSignal = divergence > divergenceThreshold and spxMomentum > 0 and spyTrendUp;
def putSignal = divergence < -divergenceThreshold and spxMomentum < 0 and spyTrendDown;

# === PLOT SIGNALS ===
plot BuyCall = if callSignal then low - 0.1 else Double.NaN;
plot BuyPut = if putSignal then high + 0.1 else Double.NaN;

BuyCall.SetPaintingStrategy(PaintingStrategy.ARROW_UP);
BuyCall.SetDefaultColor(Color.GREEN);
BuyCall.SetLineWeight(2);

BuyPut.SetPaintingStrategy(PaintingStrategy.ARROW_DOWN);
BuyPut.SetDefaultColor(Color.RED);
BuyPut.SetLineWeight(2);

# === DEBUGGING / INFO LABELS ===
AddLabel(yes, "SPX Δ: " + Round(spxChange, 2) + " | SPY Δ: " + Round(spyChange, 2), Color.GRAY);
AddLabel(yes, "Divergence: " + Round(divergence, 2) + "%", if divergence > 0 then Color.GREEN else Color.RED);
thinkorswim
Create a study
In thinkorswim
Tools » thinkScript
Click the + in the top right corner and select Study
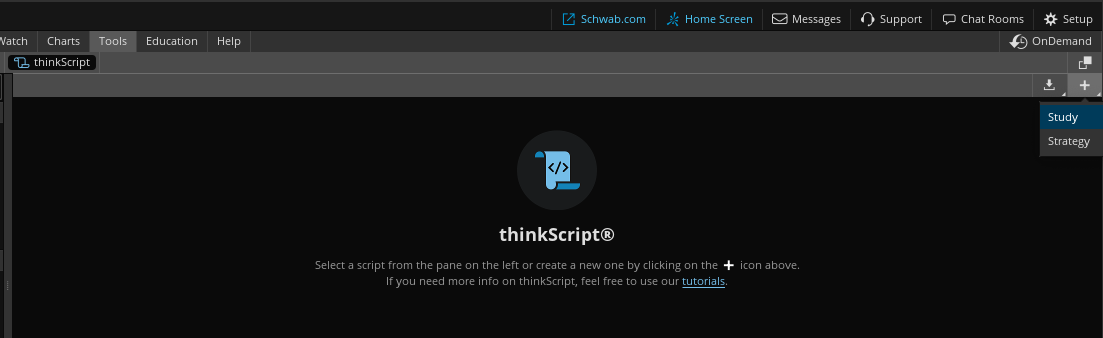
Give it a name
Copy your LLMs thinkScript and paste it over the boilerplate in the thinkScript editor. If your script has errors they should show up in a pane under the editor.
Click save (top right corner)
Add your study to a chart
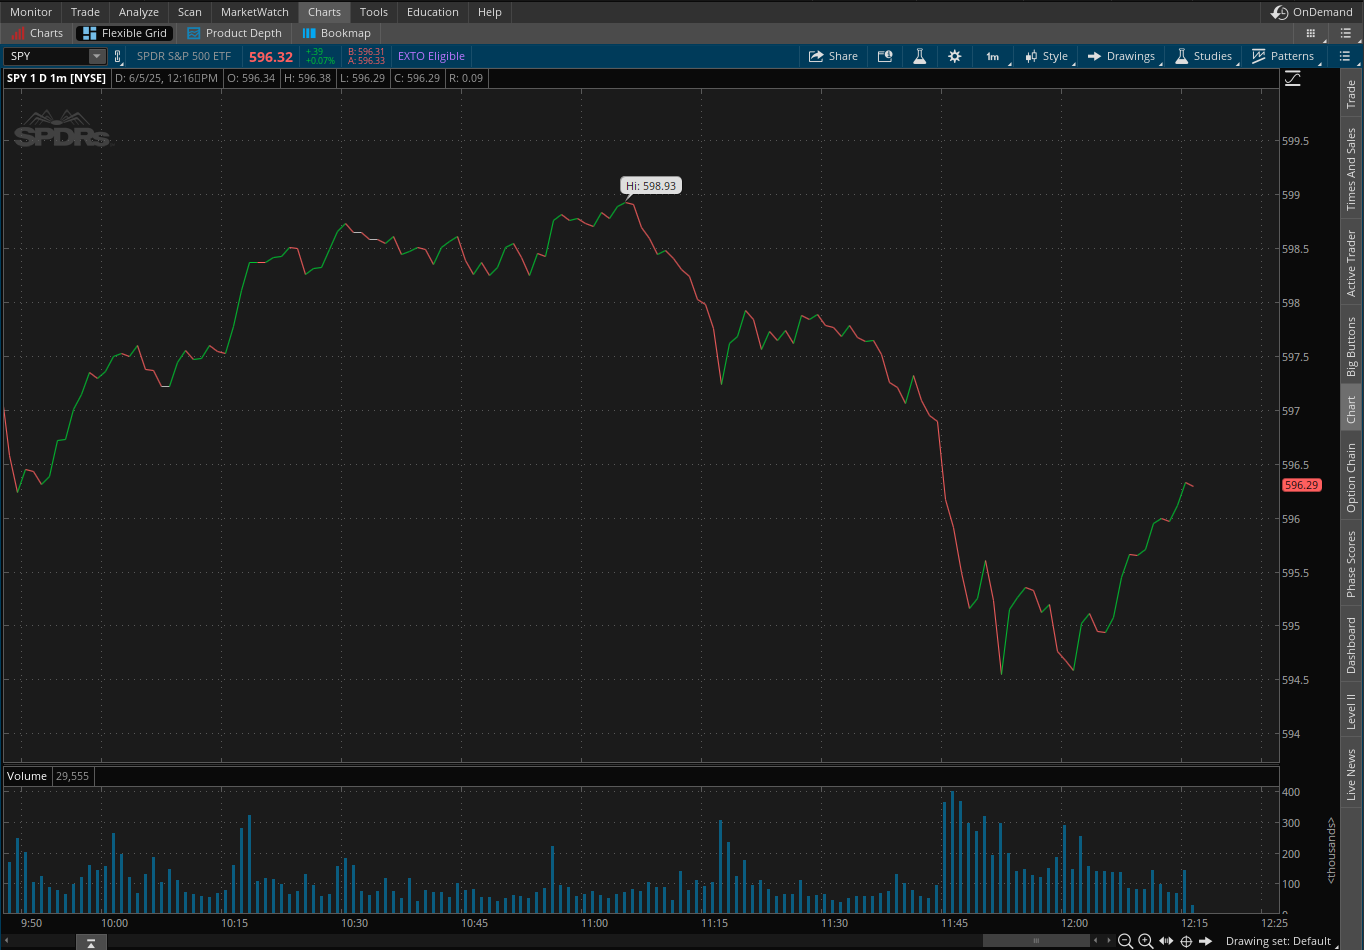
You could do this in multiple spots, but I’m using Charts » Flexible Grid. I’m starting with an SPY 1m chart
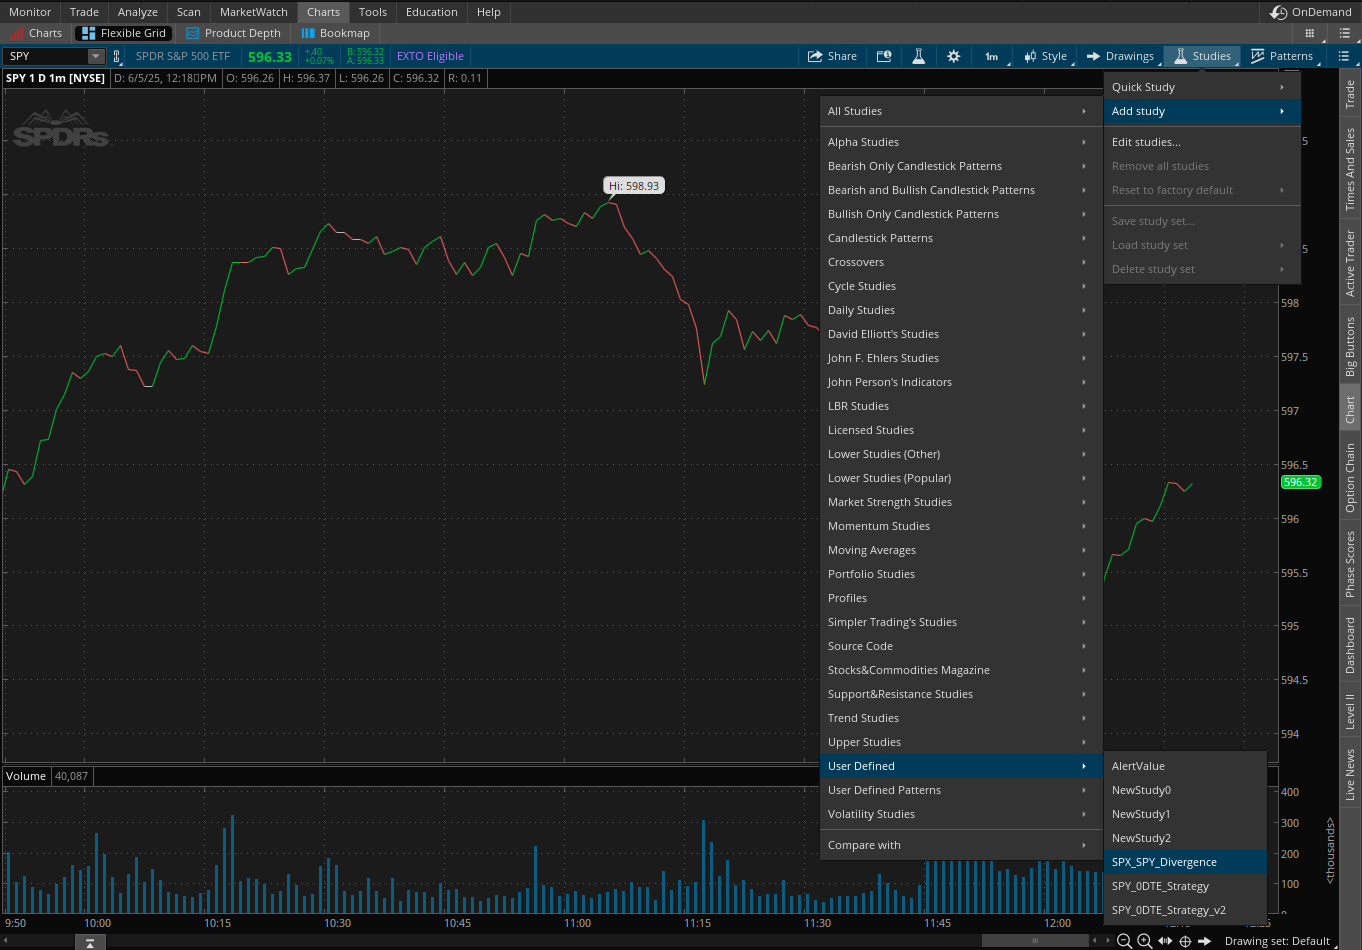
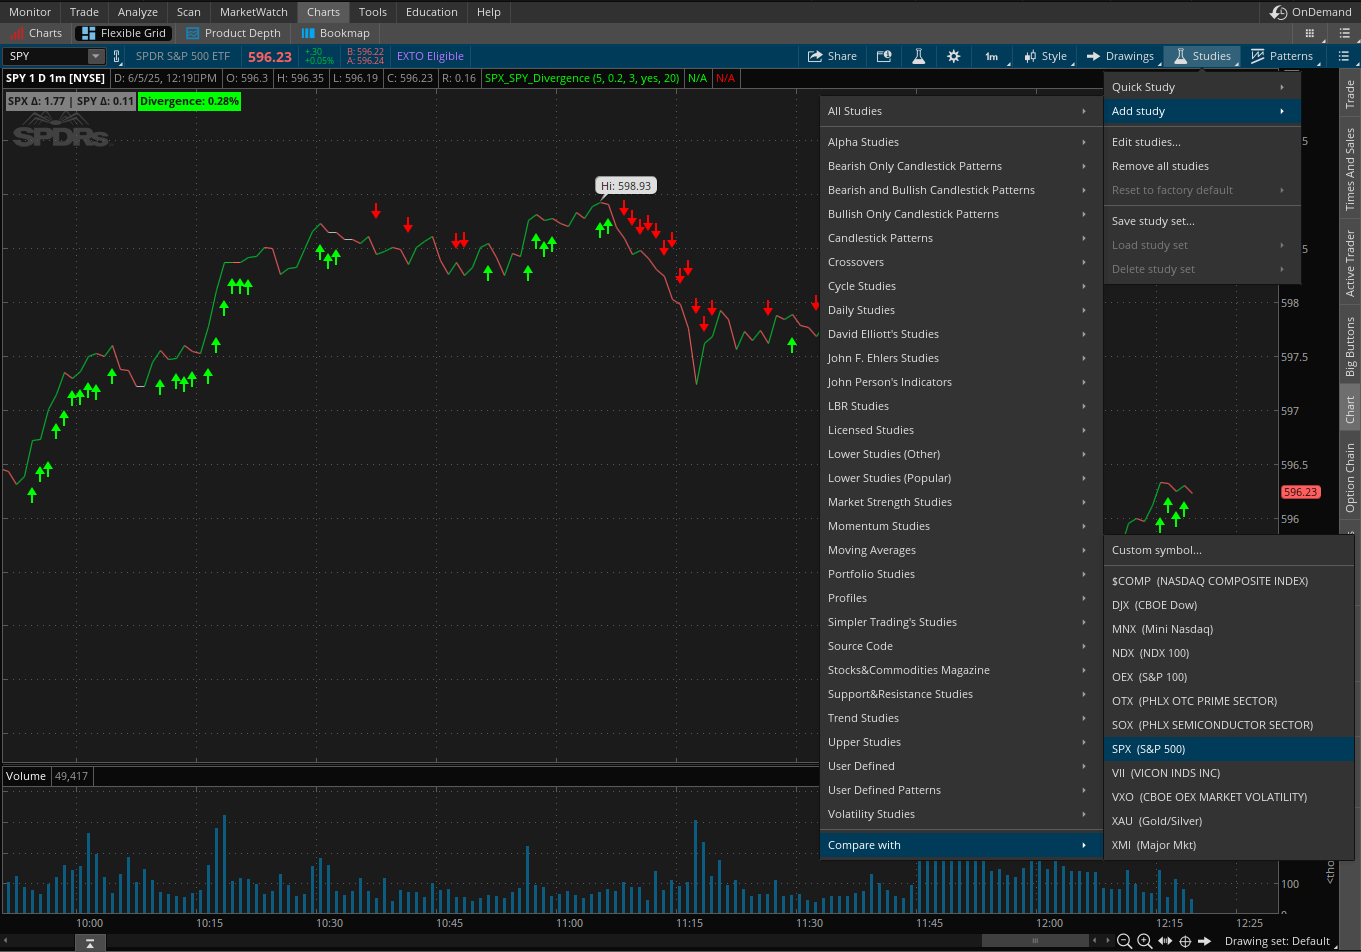
Studies » Add study » User Defined, and pick your study
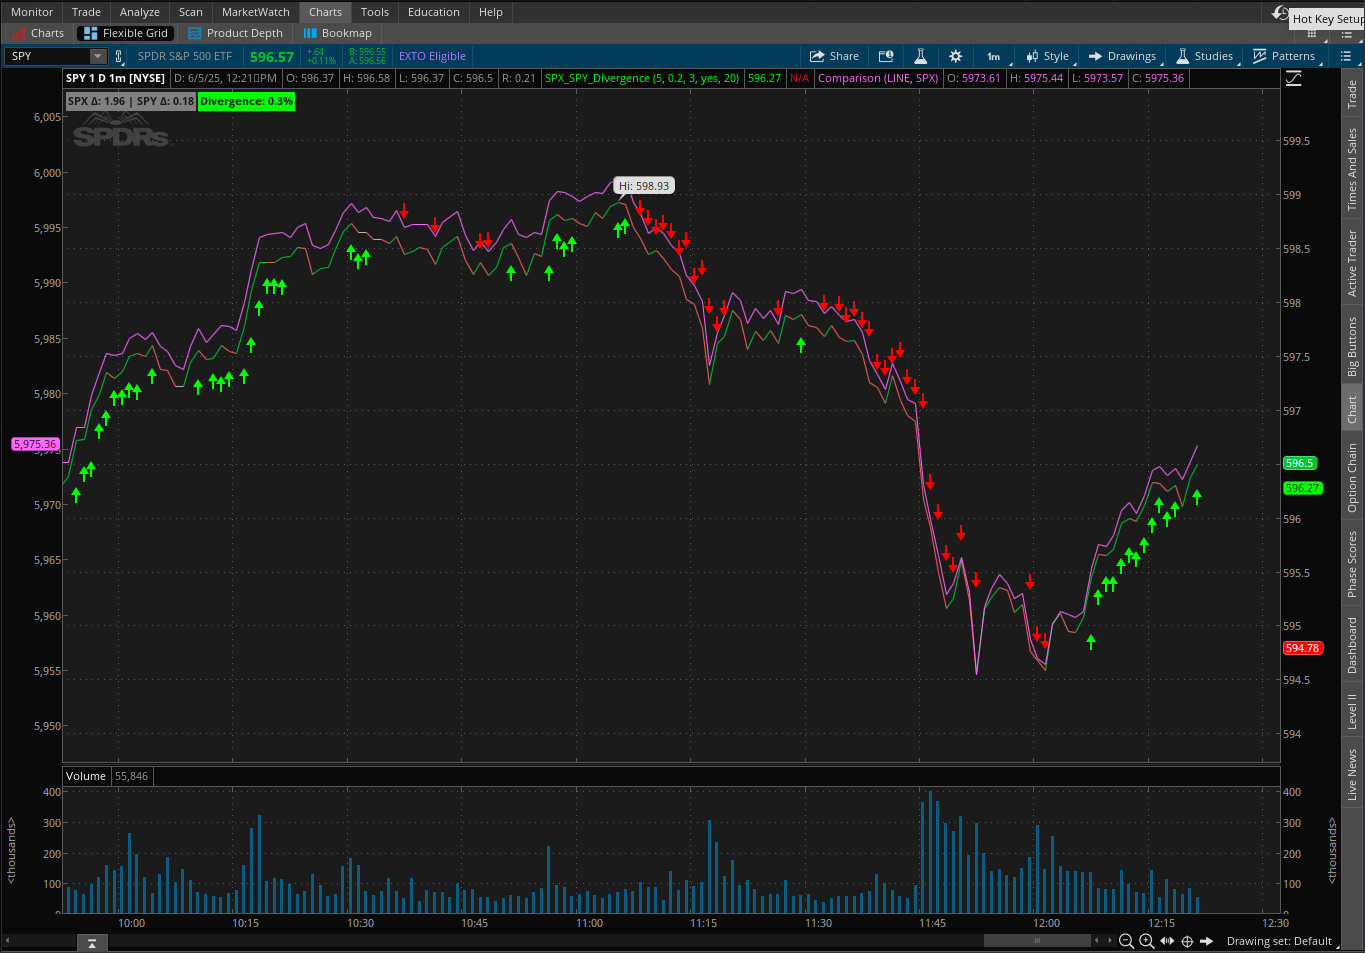
Your study should now be visible
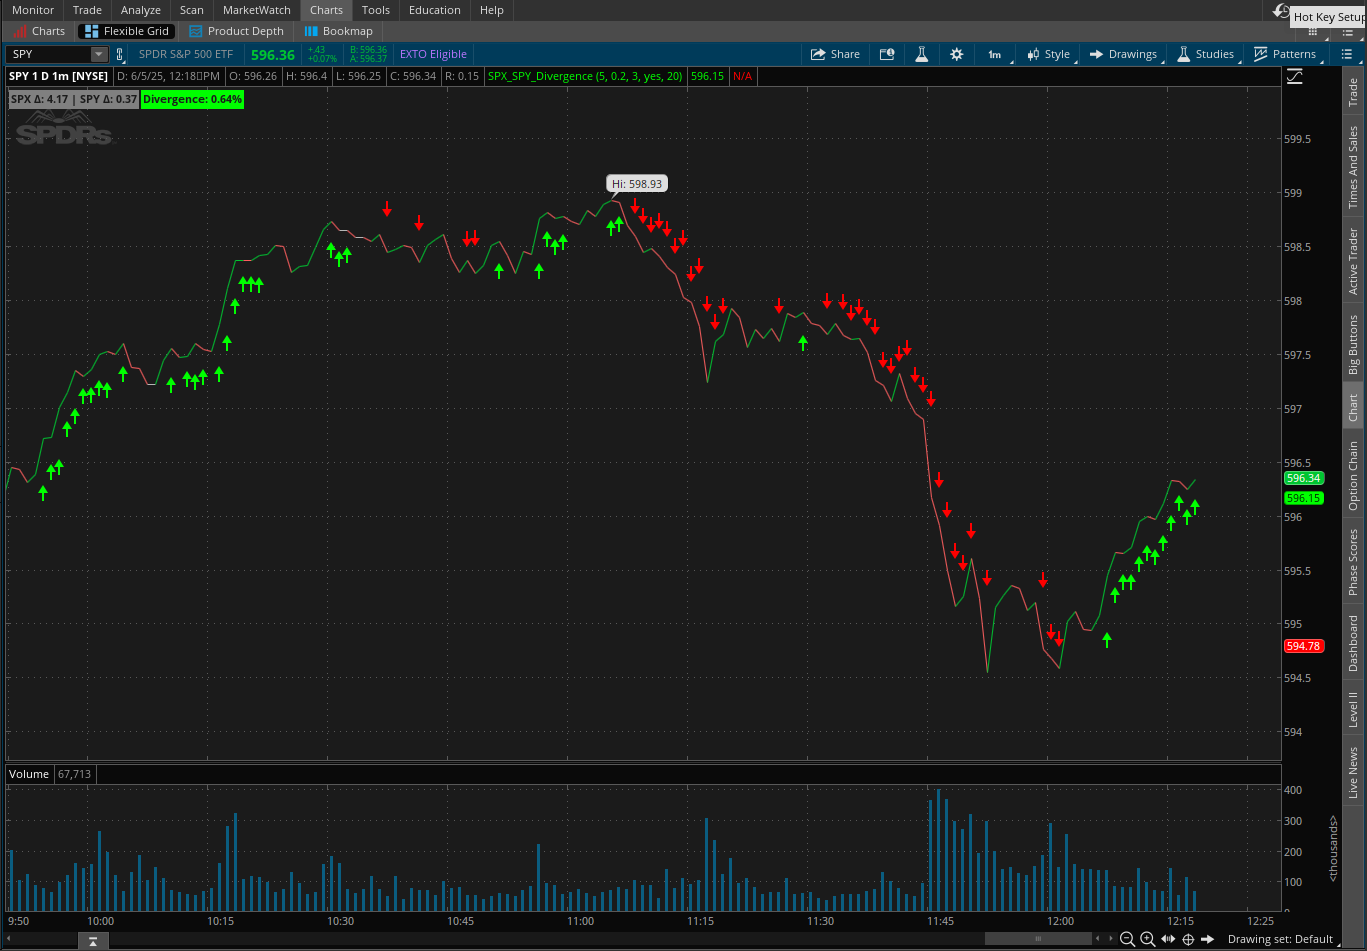
Since my strategy is based on SPY and SPX, you can add SPX on here by going to Studies » Add study » Compare with (if you want an arbitrary symbol pick Custom symbol)
Now get to iterating.
e.g.,
Add Alert() sounds. Bell for buy call, ding for buy put. Throttle it so the alerts don’t go nuts.